Riding life is like surfing waves has up and down.” |
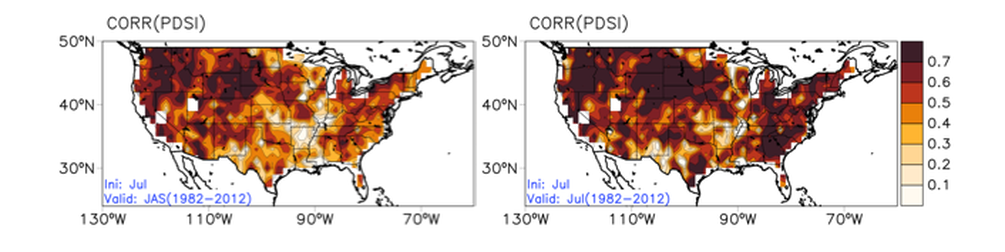
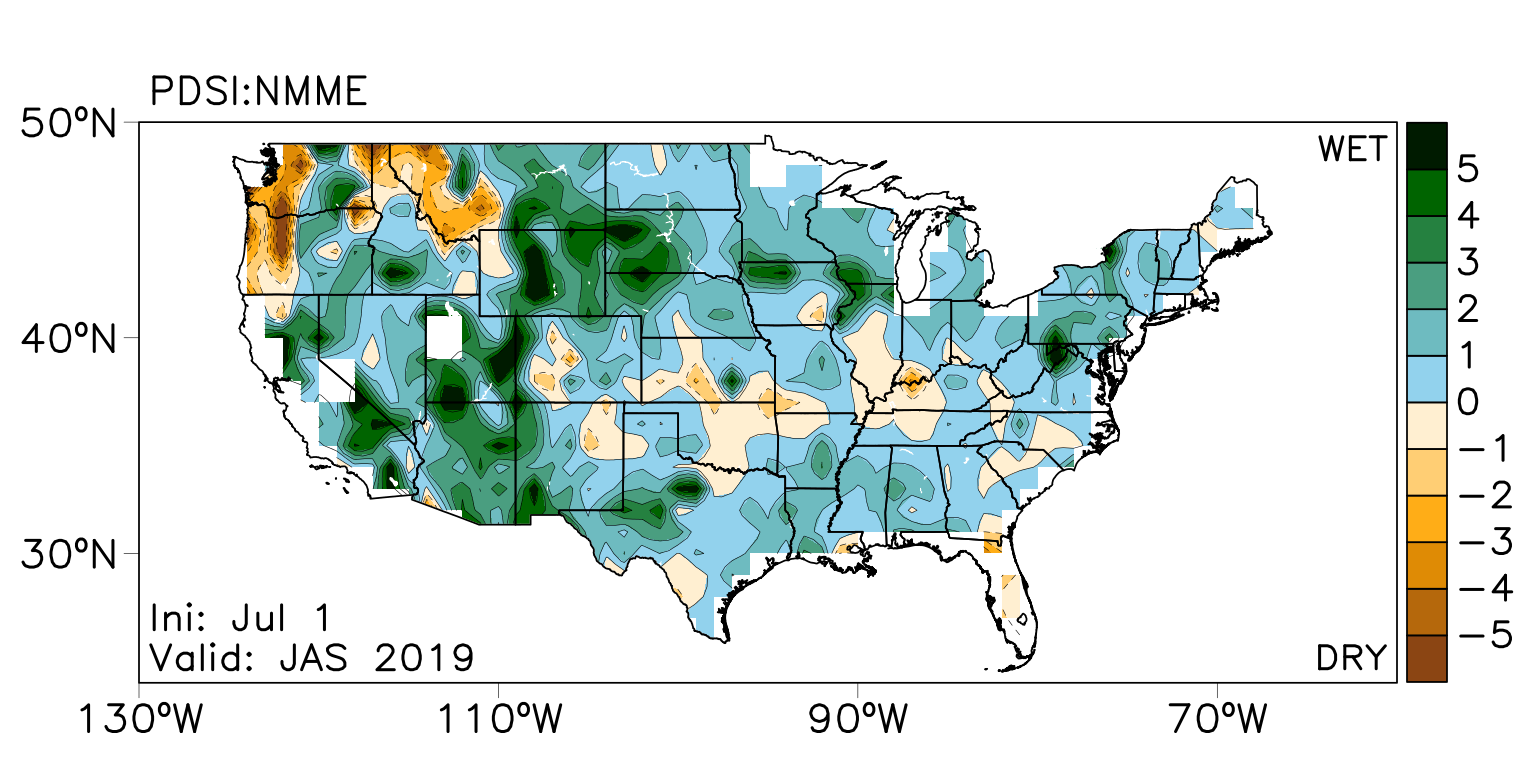
The Palmer Drought Severe Index (PDSI) is forecasted for the following season (top figure). Negative values represent dry conditions and the opposite for positive values, and the three-month season is also shown on a monthly basis. The PDSI is calculated as in Palmer (1965). Precipitation and temperature used to compute the forecasted PDSI are taken from the set of model ensemble monthly runs from the North American Multi-Model Ensemble (NMME; Kirtman et al., 2014). This PDSI forecast was post-processed with an ensemble model statistics output (EMOS) using the Non-homogeneous Gaussian Regression (Gneiting et al., 2005) approach, in a similar way employed to compute the Spring Index forecast (bit.ly/SI-x; Carrillo et al., 2018). Verification for the previous year is shown in the table below using anomaly correlation and observed information from the NE Drought Atlas. The historical validation is for the period 1982-2010 using two metrics: (1) local skill with correlation (figure above), and (2) global skill with anomaly correlation (bit.ly/pdsi-x).
|

Get In Touch
|
A link for the semi-operational forecasting is here bit.ly/pdsi-x.
|
