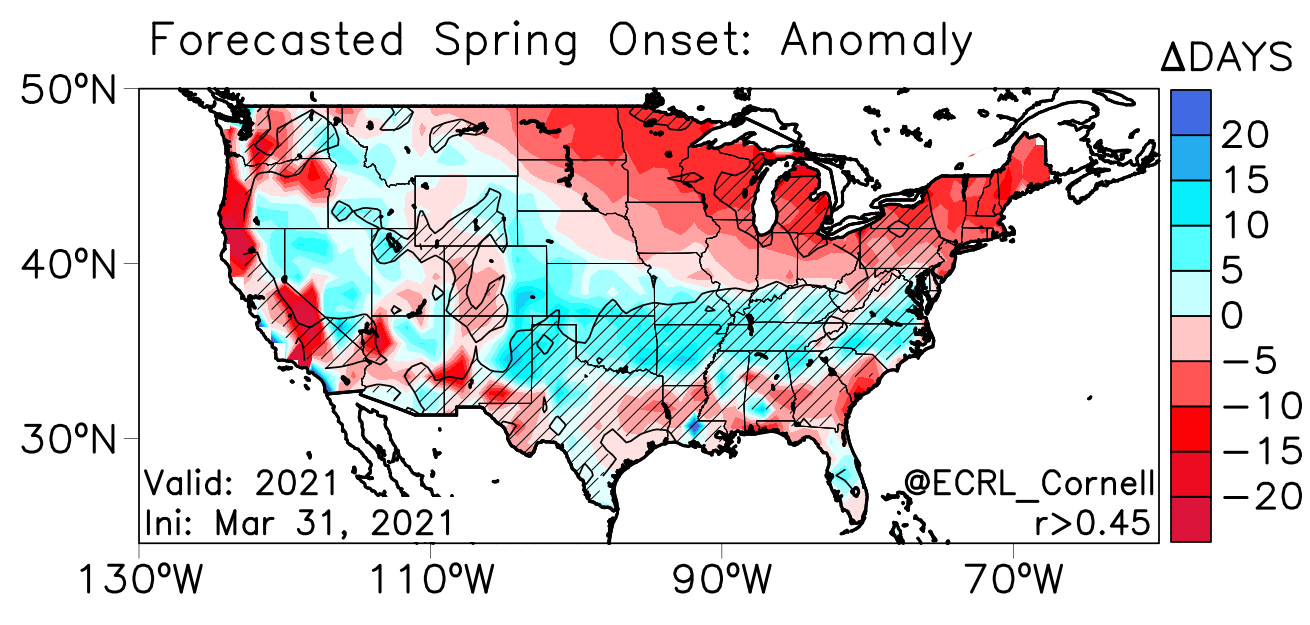
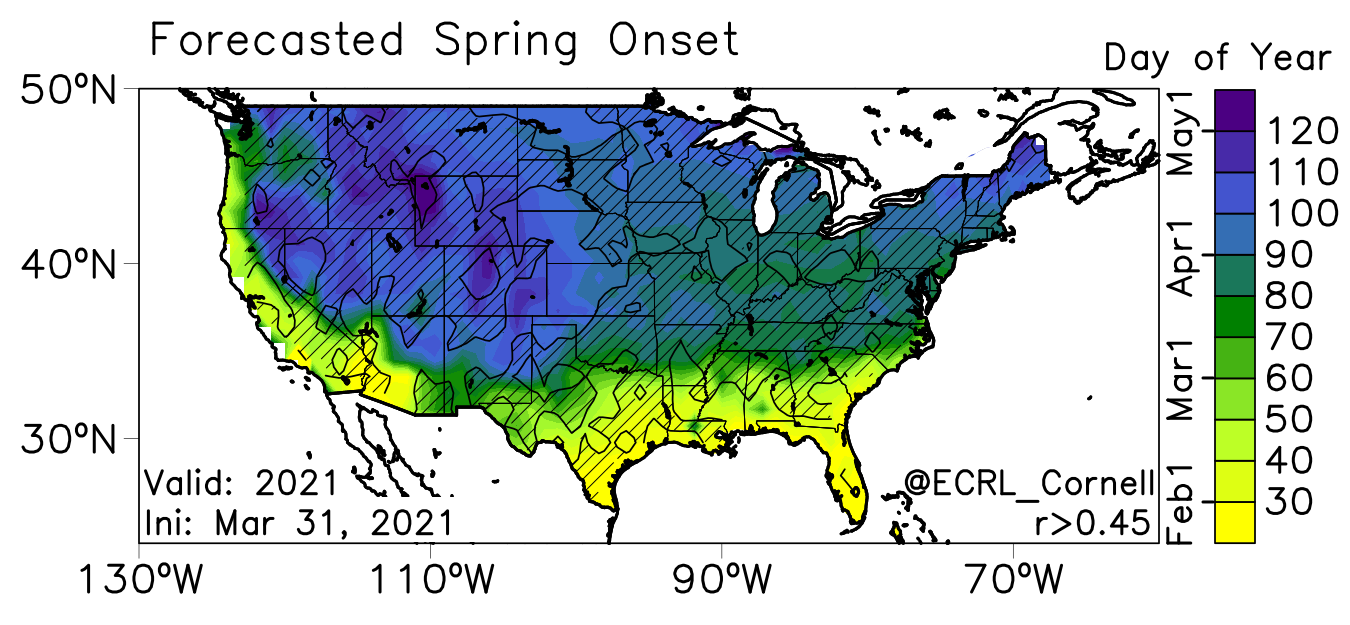
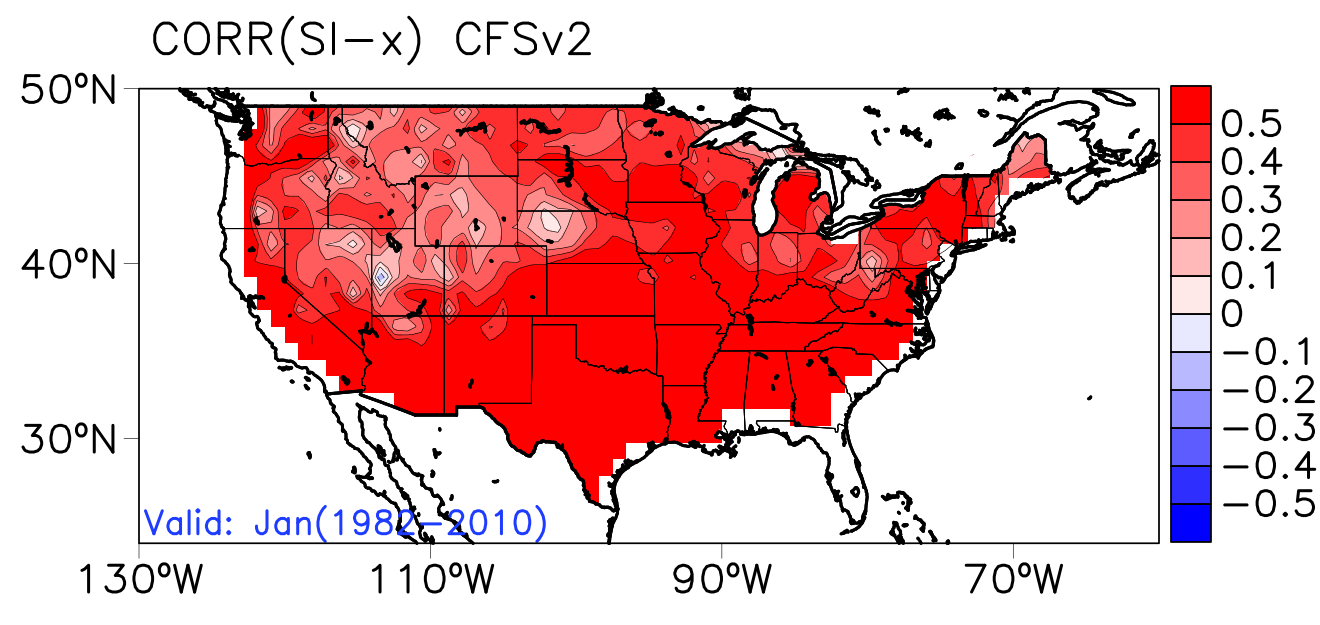
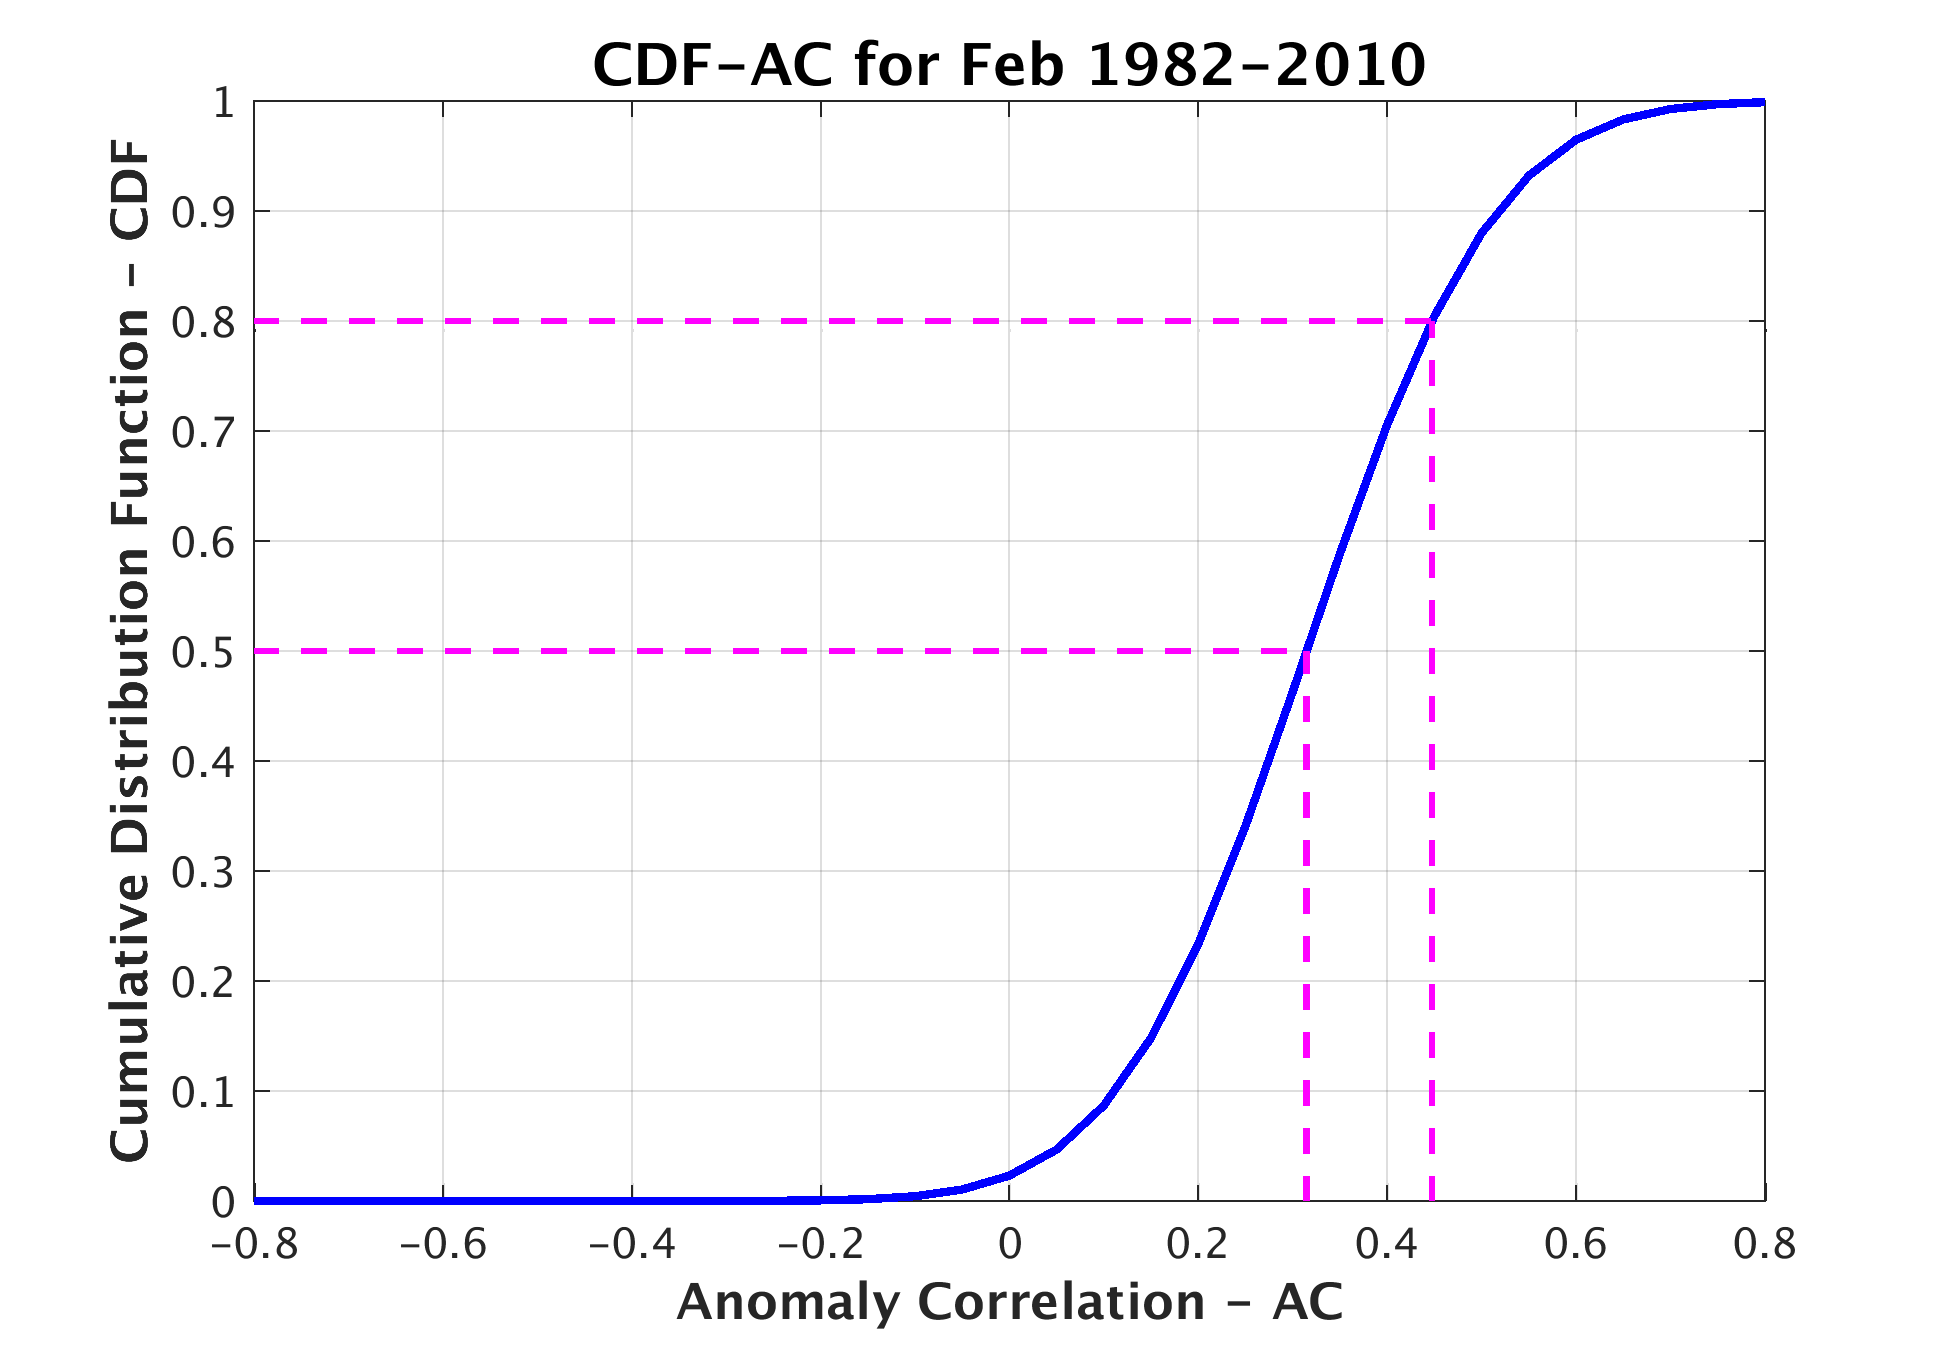
The map above shows the spring onset forecasting anomaly (ΔSI-x; spring index anomaly) in units of days. Negative values mean early onset from a climatology defined for the period 1982-2010, and positive values for late-onset. The black solid lines indicate validated regions where the spring onset has correlation thresholds of r > 0.45. The forecasted day of the spring onset (SI-x) is indicated in the table below in calendar days or Day-Of-the-Year (DOY) units. Products related to the SI-x forecast are shown in four field maps in the table below for different initializations (Jan 31, Feb 28, etc): (1) the Spring Index anomaly; (2) the Spring Index; (3) a global skill that is defined as CDF of centered anomaly correlation for the entire domain (Wilks, 2011); two thresholds (0.5 and 0.7) identify skill for different initializations; (4) a local skill defined using Pearson correlation.
Carlos M. Carrillo and Toby R. Ault Emergent Climate Risk Lab, @ECRL_Cornell Dept. of Earth & Atmos. Sciences, Cornell University
The SI-x is computed as in Ault et al. (2015) with current climatic conditions which data sets are multiple simulations of daily maximum and minimum temperature of the CFSv2 model. The SI-x product was post-processing using an ensemble model statistic output (EMOS), Non-homogeneous Gaussian Regression (Gneiting et al., 2005). The different ensemble members are defined with four daily runs with different initializations: 00Z, 06Z, 12Z, and 18Z. Thus, a total of 120 model realizations are used in each issued SI-x forecast. The EMOS product is calibrated with a re-forecasting dataset from 1982-2010 and further details can be found in Carrillo et al. (2018).
